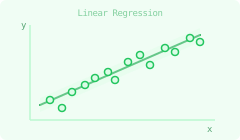
Statistical inference is the science of drawing conclusions about unknown parameters from data. This topic covers the foundational criteria for estimators, the two main estimation methods (MOM and MLE), confidence intervals, hypothesis testing, and linear regression. These tools appear directly in quant interviews involving data analysis, model validation, and quantitative research.
1. Estimator Properties
1.1 Bias, Variance, MSE
Definition
Let θ^=θ^(X1,…,Xn) be an estimator of a parameter θ. The three fundamental quality criteria are:
Bias(θ^)=E[θ^]−θVar(θ^)=E[(θ^−EMSE(θ^)=E[(θ
An estimator is unbiased if Bias(θ^)=0, i.e. E[θ^]=θ.
The bias-variance tradeoff is central to statistics and machine learning: reducing bias often increases variance and vice versa. In interviews, an unbiased estimator is not always preferable — a slightly biased estimator with much lower variance can have smaller MSE.
1.2 Consistency & Efficiency
Definition
An estimator θ^n is consistent if:
Properties
Unbiased + Var(θ^n)→0⇒ consistent
Consistent does not imply unbiased (and vice versa)
The MLE is consistent and asymptotically efficient under regularity conditions
1.3 Cramér-Rao Bound & Fisher Information
Definition— Fisher Information
For a model with density f(x;θ), the Fisher information is:
Theorem— Cramér-Rao Lower Bound
For any unbiased estimator θ^ of θ:
💡Tip
Fisher information measures how much data tells you about θ. High Fisher information = sharper likelihood = more precise estimation. An estimator achieving the Cramér-Rao bound is called efficient — MLE achieves it asymptotically.
2. Estimation Methods
2.1 Method of Moments (MOM)
Definition
The method of moments estimates parameters by equating theoretical moments to empirical moments. For k parameters (θ1,…,θk), solve:
Example
For X∼Γ(α,β): E[X]=α/β and . Setting and , solving gives and .
💡Tip
MOM is simple and always gives explicit formulas, but is generally less efficient than MLE. Use MOM when you need a quick closed-form estimator or as a starting point for MLE optimization.
2.2 Maximum Likelihood Estimation (MLE)
Definition
Given i.i.d. observations X1,…,Xn∼f(⋅;θ), the likelihood and log-likelihood are:
Properties
Invariance: if θ^ is the MLE of θ, then g(θ^) is the MLE of
Example
For Xi∼Exp(λ): ℓ(λ)=nlogλ. Setting gives .
💡Tip
Always work with the log-likelihood ℓ(θ) — products become sums, making differentiation tractable. For exponential family distributions, the MLE always has a clean closed form.
2.3 Asymptotic Properties of MLE
Theorem— Asymptotic Normality of MLE
Under regularity conditions, as n→∞:
Remarque
This theorem says the MLE is asymptotically efficient — it achieves the Cramér-Rao bound in the limit. The asymptotic variance 1/(nI(θ)) is the best possible variance for any unbiased estimator.
3. Confidence Intervals
3.1 Definition & Interpretation
Definition
A confidence interval (CI) at level 1−α for parameter θ is a random interval [L(X),U(X)] such that:
Remarque
The CI is random, not θ. The correct interpretation: if we repeat the experiment many times, (1−α)×100% of the constructed intervals will contain the true θ. It is wrong to say "θ has probability of being in the interval" — is fixed, not random.
3.2 CI for the Mean (known σ)
Formula
For X1,…,Xn i.i.d. with mean μ and known variance , by the CLT:
3.3 CI for the Mean (unknown σ)
Formula
For X1,…,Xn i.i.d. N(μ,σ with , using :
Remarque
This uses the fact that S/n exactly under normality. As , and both formulas agree.
3.4 CI for a Proportion
Formula
For X1,…,Xn i.i.d. Bernoulli(p) with :
💡Tip
The duality between CI and hypothesis tests: θ0 is rejected at level α by a two-sided test if and only if θ0 falls outside the CI. This equivalence lets you read off test decisions directly from CIs.
4. Hypothesis Testing
4.1 Framework: H0, H1, Errors, p-value
Definition
A hypothesis test decides between:
Null hypothesisH0: the default assumption
Alternative hypothesisH1: what we want to detect
The test statistic leads to rejection of when (rejection region).
Definition— Error Types & Power
α=P(reject H0∣H
Definition— p-value
The p-value is the probability, under H0, of observing a test statistic at least as extreme as the one observed:
Remarque
The p-value is not the probability that H0 is true. It is the probability of the data (or more extreme) given H0 is true. A small -value means the data is unlikely under , not that is unlikely.
4.2 Common Tests
Properties— Standard Tests
Test
H0
Statistic
Distribution under H0
z-test
( known)
💡Tip
Memory rule: use z when σ is known, t when σ is unknown. The χ2 test for variance and the -test for equality of variances both require normality — they are sensitive to this assumption.
4.3 Neyman-Pearson Lemma
Theorem— Neyman-Pearson Lemma
For testing H0:θ=θ0 vs (simple hypotheses), the test at level rejects when:
Remarque
The likelihood ratio test is optimal in the sense of maximizing power for a given significance level. For composite hypotheses, the generalized likelihood ratio test uses Λ=supθ∈H1L(θ and under (Wilks' theorem).
5. Linear Regression
5.1 Model & Assumptions
Definition
The linear regression model assumes:
y=Xβ+ε,ε∼N(0,
Properties— Gauss-Markov Assumptions
L1: E[ε]=0 (zero mean errors)
L2: Cov(ε)=σ (homoscedasticity, no correlation)
5.2 OLS Estimator
Theorem— OLS Estimator
The ordinary least squares estimator minimizes ∥y−Xβ∥2 and is given by:
Properties
E[β^]=β (unbiasedness under L1--L3)
5.3 Gauss-Markov Theorem
Theorem— Gauss-Markov
Under assumptions L1--L3, the OLS estimator β^ is the Best Linear Unbiased Estimator (BLUE): among all linear unbiased estimators β~=Cy,
Remarque
Gauss-Markov does not require normality — only L1--L3. Adding normality (L4) gives exact t and F distributions for inference. Without normality, the CLT provides approximate inference for large n.
5.4 Goodness of Fit (R2)
Definition
The coefficient of determinationR2 measures the proportion of variance in y explained by the model:
Properties
R2=0: model explains nothing; R2=1: perfect fit
R increases with every added predictor — use to penalize complexity:
💡Tip
A high R2 does not imply a good model — it can be inflated by irrelevant predictors (use adjusted R2), by outliers, or by spurious correlations. Always check residual plots alongside R2.
6. Quick Reference
Estimator Criteria
Criterion
Definition
Unbiased
E[θ^]=θ
MSE
Var(θ^)+Bias
Confidence Intervals
Parameter
CI
μ (σ known)
Xˉ±zα/2σ/
Regression Formulas
Concept
Formula
OLS estimator
β^=(XTX)−1XT
[
θ^
]
)2
]
^
−
θ
)2
]
=
Var
(
θ^
)
+
Bias
(
θ^
)2
E
[
Xˉn
]
=
μ
Sample variance S2=n−11∑(Xi−Xˉ)2 is unbiased for σ2
n1∑(Xi−Xˉ)2 is biased for σ2 — the n−1 correction matters
θ^
n
P
θ
as
n
→
∞
An estimator θ^ is efficient if it achieves the Cramér-Rao lower bound (minimum variance among all unbiased estimators).
I(θ)=E[(∂θ∂logf(X;θ))2]=−E[∂θ2∂2logf(X;θ)]
The quantity ℓ′(θ)=∂θ∂logf(X;θ) is called the score function, satisfying E[ℓ′(θ)]=0.
Var(θ^)≥In(θ)1=nI(θ)1
where In(θ)=nI(θ) is the Fisher information of the full sample.
Eθ[Xj]=n1i=1∑nXij,j=1,…,k
E[X2]=α(α+1)/β2
Xˉ=α/β
X2=α(α+1)/β2
α^=Xˉ2/(X2−Xˉ2)
β^=Xˉ/(X2−Xˉ2)
L(θ)=i=1∏nf(Xi;θ),ℓ(θ)=i=1∑nlogf(Xi;θ)
The MLE is:
θ^MLE=argθmaxℓ(θ)
found by solving the likelihood equationℓ′(θ)=0.
g
(
θ
)
Consistency: θ^MLEPθ under regularity conditions
Asymptotic normality: see section 2.3
−
λ∑Xi
ℓ′(λ)=n/λ−∑Xi=0
λ^MLE=1/Xˉ
n
(
θ^MLE
−
θ
)
d
N
(0,I(θ)1)
Equivalently: θ^MLE is approximately N(θ,nI(θ)1) for large n.
P(L(X)≤θ≤U(X))=1−α
1−α
θ
σ
2
Xˉn±zα/2nσ
where zα/2=Φ−1(1−α/2). For 95% CI: z0.025=1.96.
2
)
unknown
σ2
S2=n−11∑(Xi−Xˉ)2
Xˉn±tα/2,n−1nS
where tα/2,n−1 is the α/2 quantile of the Student-t distribution with n−1 degrees of freedom.
Xˉ
n
−
μ
∼
t(n−
1)
n→∞
t(n−1)→N(0,1)
p^=Xˉn
p^±zα/2np^(1−p^)
(1−α)
T
(
X1
,
…
,
Xn
)
H0
T∈R
0
true
)
(Type I error, significance level)
β=P(fail to reject H0∣H1 true)(Type II error)
Power=1−β=P(reject H0∣H1 true)
p-value=PH0(T≥tobs)
Reject H0 at level α if and only if p-value≤α.
p
H0
H0
μ=μ0
σ
Z=σ/nXˉ−μ0
N(0,1)
t-test (one-sample)
μ=μ0 (σ unknown)
T=S/nXˉ−μ0
t(n−1)
t-test (two-sample)
μ1=μ2
T=Sp1/n1+1/n2
t(n1+n2−2)
χ2-test
σ2=σ02
χ2=σ02(n−1)S2
χ2(n−1)
F-test
σ12=σ22
F=S12/S22
F(n1−1,n2−1)
F
H
1
:
θ=
θ1
most powerful
α
H0
Λ(X)=L(θ0)L(θ1)=∏f(Xi;θ0)∏f(Xi;θ>k
where k is chosen so that PH0(Λ(X)>k)=α.
)
/
supθ∈H0
L
(
θ
)
−2logΛdχ2(k)
H0
σ
2
In
)
where y∈Rn is the response vector, X∈Rn×p is the design matrix (with first column of ones for the intercept), β∈Rp is the parameter vector, and ε is the noise.
2
In
L3: X has full column rank p (no multicollinearity)
L4 (for exact inference): ε∼N(0,σ2In)
β^=(XTX)−1XTy
Cov(β^)=σ2(XTX)−1
Fitted values: y^=Xβ^=Hy where H=X(XTX)−1XT is the hat matrix